Other5 min read
Loyalty starts with accurate product information, not with a points scheme
The link between accurate product pages, fewer disappointing deliveries and repeat buying, plus the loyalty metrics you can actually measure.
By CharpstAR · 22 Sept 2026

Most loyalty programmes are built on rewards. Points, tiers, birthday discounts. They work at the margins, and they are also the second thing you should do. The first is much less exciting: make sure the thing that arrives at the door is the thing the customer thought they were buying.
A customer who opens the box and finds exactly what they expected is a customer who will buy from you again without being bribed. A customer who is surprised, even mildly, has learned that your product pages cannot be trusted, and that lesson lasts longer than any discount code.
This article is about the part of loyalty that sits in the product page, and about which bits of it you can actually measure.
The disappointment gap
Every online purchase involves a gap between what the customer imagined and what they receive. Photography narrows it. Good copy narrows it. Reviews narrow it. But some products leave a large gap no matter how good the photography is, because the missing information is spatial: how big it is, how it reads in a real room, what it looks like from the angle nobody photographed.
That gap is where returns come from, and returns are expensive at a scale most people underestimate. The National Retail Federation put United States returns at 743 billion dollars in 2023, 14.5 percent of total sales, with online running higher at 17.6 percent, or 247 billion dollars of merchandise bought online and sent back.
The cost of a return is not only the logistics. It is the customer deciding that ordering from you is a gamble.
What closing the gap looks like on the page
A correctly scaled 3D model is the cheapest way to close a spatial gap. The shopper rotates it, sees the back and the underside, reads the dimension lines, and on a phone places it in the actual room at true size. There is no interpretation left to do. What they see is what ships.
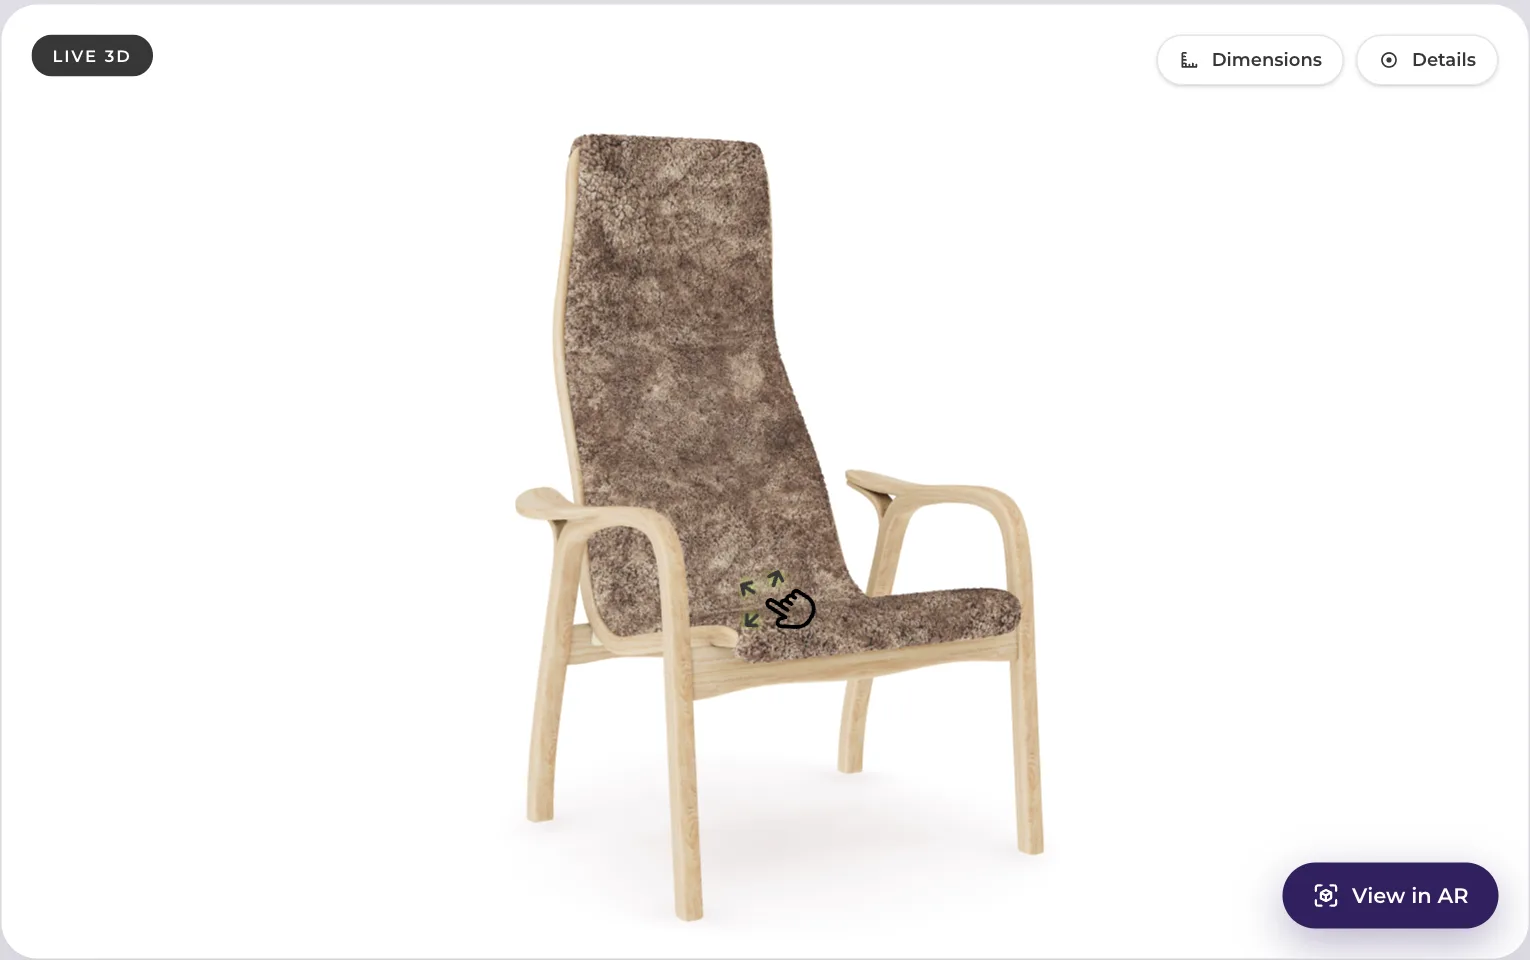
The same principle extends past 3D. An honest product page states the material by name, gives dimensions in the customer's units, shows the colour under neutral light, says what is in the box, and is specific about delivery. None of that is glamorous and all of it reduces the chance of a bad opening.
What the evidence supports, and what it does not
Be careful here, because loyalty is the claim most often made without numbers.
What is documented: Shopify reported that Gunner Kennels reduced return rates by 5 percent after adding AR, and that shoppers interacting with Rebecca Minkoff products in 3D were 44 percent more likely to add to cart and 27 percent more likely to place an order, with a 65 percent purchase lift on AR-enabled pages. Shopify's 2020 merchant data showed products with 3D or AR content converting 94 percent more often than comparable products without.
What is not documented, anywhere public that we can find: a controlled study showing that adding AR raises repeat purchase rate. Anyone quoting a precise loyalty uplift figure for AR is almost certainly quoting a survey of stated intent, which is a different thing from behaviour.
So the honest chain of reasoning is this. Accurate information reduces returns. Returns are a strong negative signal for repeat purchase. Therefore accurate information should support repeat purchase. That is a reasonable inference, not a measured result, and you should measure it yourself rather than take it on faith.
The metrics that will tell you the truth
| Metric | How to measure it | What it tells you |
|---|---|---|
| Return rate by product | Returns divided by orders, per SKU, monthly | The direct effect of better information |
| Return reason mix | Tag returns as size, colour, quality, damage, changed mind | Whether the returns you are fixing are the ones 3D can fix |
| Repeat purchase rate at 90 and 180 days | Share of customers who order again in the window | The actual loyalty number, lagging but real |
| Second-order category | What a returning customer buys next | Whether confidence transfers across the catalogue |
| Customer service contacts per order | Tickets divided by orders, per product | Pre-purchase uncertainty showing up as work for your team |
| Review sentiment on accuracy | Share of reviews mentioning size, colour or expectation | Cheap early warning before it reaches the return rate |
The two most useful are return reason mix and service contacts per order. Both move within weeks, both are cheap to instrument, and both tell you whether the money you spent on product information did anything. Repeat purchase rate is the one that matters most and moves slowest, so set the baseline now if you intend to claim credit later.
What we see with our own clients
Our evidence is operational rather than statistical, and we will label it as such. Sweef put modular sofas into a configurator that shoppers could place in their own room, and the questions that used to reach customer service about whether a particular combination would fit largely stopped arriving. Contura sells wood-burning stoves, where a customer who orders the wrong size has a genuinely bad week, and placing the stove in the room at real scale before ordering removes that. MELIMELI reuses the same models across the shop and campaigns so that what the customer saw in an ad and what they see on the page are literally the same object.
That last point is underrated. Inconsistency between the ad image, the page image and the delivered product is its own disappointment gap, and one asset used everywhere closes it for free.
Where this stops working
Accurate information does not rescue a bad product. If the chair is uncomfortable, showing it more clearly will reduce returns caused by surprise and increase returns caused by the chair. That is still progress, because you find out sooner and from fewer customers, but it is not a loyalty strategy on its own.
It also does not fix slow delivery, unclear return policies or unhelpful service. Those are the other three legs of the same table, and 3D will not carry them.
A reasonable first step
Take your ten worst products by return rate. Read the return reasons. If size, scale or appearance dominate, those are the products where a 3D model will pay for itself, and where the loyalty effect, if you get one, will be visible.
We will build a model of one of them for free so you can start that comparison without a budget conversation. Send us the product. What a full programme looks like is on solutions, and the pricing is on prices.
Sources
- National Retail Federation and Appriss Retail, 2023 Consumer Returns in the Retail Industry.
- Shopify, AR shopping: Rebecca Minkoff and Gunner Kennels results.
- Shopify, merchant data on 3D and AR content, September 2020.